These measures are intriguing as forecasting tools, as it is highly
plausible that, given wage and price stickiness, individuals embed
expectations of future inflation into their price-setting and
decision-making behavior today. In fact, if you’ve read or listened to a
Federal Reserve official lately, chances are you’ve probably heard
something to the effect of “inflation expectations matter.” Indeed,
central bankers’ sensitivity to inflation expectations seems warranted,
as it is theoretically possible that expectations can be self-fulfilling
prophecies. However, we are mainly interested in the forecasting
properties of these measures here.
They conclude that there is no standout method. They were impressed with the ability of 'inflation expectations' to accurately anticipate the correct level of inflation. Specifically, they noticed that measurements of inflation expectation such as the UM survey and the Philly Fed's SPF, mentioned earlier, produced forecasts that were more accurate than most of the statistically based models they investigated.
Here is the 4th Q 2010 result from the SPF survey. The columns show 'previous' next to 'current' estimates. The previous estimate is from the 3rd Q 2010 survey. The current outlook for the headline and core measures of CPI and PCE inflation in 2011 and 2012 is lower than it was in the last survey. Over the next 10 years, 2010 to 2019, the forecasters expect headline CPI inflation to average 2.2 percent at an annual rate, down from 2.3 percent in the last survey.
Headline CPI
|
Core CPI
|
Headline PCE
|
Core PCE
|
|||||
|---|---|---|---|---|---|---|---|---|
Prev.
|
Curr.
|
Prev.
|
Curr.
|
Prev.
|
Curr.
|
Prev.
|
Curr.
|
|
| Quarterly | ||||||||
| 2010: Q4 |
1.6
|
1.9
|
1.2
|
1.0
|
1.5
|
1.7
|
1.1
|
1.0
|
| 2011: Q1 |
1.8
|
1.6
|
1.2
|
1.1
|
1.7
|
1.5
|
1.4
|
1.1
|
| 2011: Q2 |
1.6
|
1.3
|
1.4
|
1.3
|
1.5
|
1.2
|
1.4
|
1.1
|
| 2011: Q3 |
1.9
|
1.8
|
1.6
|
1.3
|
1.7
|
1.4
|
1.5
|
1.2
|
| 2011: Q4 |
N.A.
|
1.8
|
N.A.
|
1.5
|
N.A.
|
1.6
|
N.A.
|
1.3
|
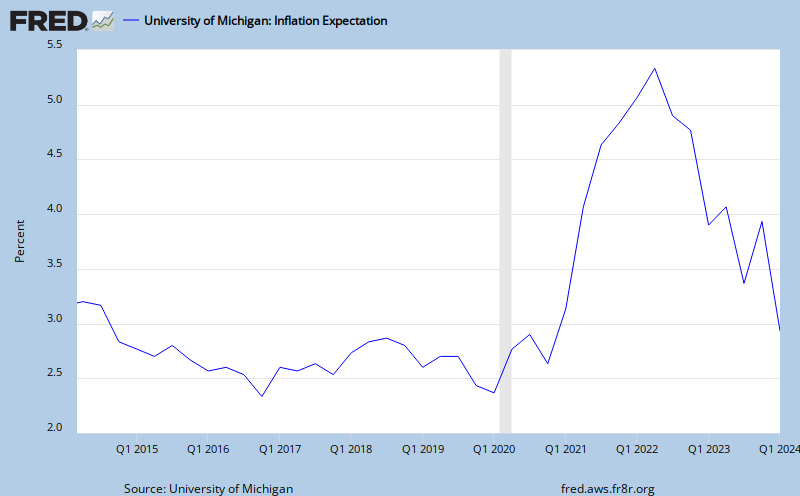
Here is the most current data from the UM Inflation Expectation survey.
Latest Observations:
| Date | 2010-06 | 2010-07 | 2010-08 | 2010-09 | 2010-10 |
| Value | 2.8 | 2.7 | 2.7 | 2.2 | 2.7 |
Also from the St Louis Fed, the following graph showing the past ten years of quarterly inflation expectations.
Trying to fit this information into the mainstreet reality, there must be price deflation in most of the measured goods and services. With the annual increase, realised and expected, for education, health care, insurance premium's, food and energy, the rest of the bucket of surveyed costs must be deflating in order to arrive at inflation expectation numbers as low as these methods provide.
Below is a chart illustrating another perspective of inflation from Shadow Government Stats (SGS), compared with that published by the Bureau of Labor Statistics (BLS).
 |
| Courtesy of ShadowStats.com |
Obviously, there is no absolute to the measurement of a bucket of price expectations. And there appears above to be wide disagreement between the measure of actual price changes experienced in the US. Shadow Stats explains this difference, and exists because of it. The difference is statistical manipulation. Not news. Knowing there is manipulation, what measure is useful. They are all useful as long as the source and method employed in arriving at the report is transparent and understood. Apparently, the BLS, UM and SPF are partnering with The Fed. Shadow Stats is not. Thus, the difference!