In Europe, the socialist government of Portugal has collapsed and is now moving on with a new center-right government. The government of Greece has had to renegotiate the bailout terms with the ECB (Germany and France) as a condition of getting the last installment of their bailout package. The renegotiated plan now calls for Greece to liquidate much of its net worth (state owned assets like airports and transportation services) as well as agree to new austerity. Can it get any more dire in Greece? Misery likes company and Italy, the eighth largest economy in the world, is drawing attention to itself for having public debt at 120% of GDP. That's second, to Greece, in the euro zone. Spain is on the radar screen now as well.
China is still wrestling with internal high food and shelter inflation threatening the massive lower classes, potentially destabilizing the power of the ruling party. Published reports describe interest rate increases are the tool to fight inflation in China, to slow lending for business and personal discretionary consumption.
In the US, the Treasury market is finding some strength on a risk-off move. The yield on the 90 day Bill is 0.00%, the 2 yr T-note is 0.19% and the 10 yr T-bond is 2.06%! The US$ is weak, trending between 73.50 and 76.00 during the past several months, and currently near the 74 mark. 'Risk off' has been a reaction to the US Congress displaying their lack of ability, building the case daily until the beginning of August when they finally extended the US public debt limit. The public display of incompetency was so much greater than expected that some economic activity slowed as a result of the spectacle and resulting loss of confidence in the leadership ability of the US government.
Calculated Risk has a summary of the recent economic reports which illustrate that the economy is not growing, but is not collapsing into recession. New home building is slow and existing home inventory is still large. Industrial production is trending sideways or improving. Same trend for production capacity utilization.
The Federal Reserve is pulling the strings to guide global perception about the strength of the US$. The Fed has no choice but to continue it's zero interest rate policy and money printing practice. They will attempt to support the Treasury market when the primary dealers and global participants back away more than they have now. As mentioned above, yields are at historic lows. Doug Noland has this caution in his blog this weekend. "Fiscal and monetary policies are rapidly losing credibility. Treasury prices may be inflated, but don’t mistake this for confidence in our system’s “core”." Financial markets around the world are expecting a return to quantitative easing (QE3) sometime soon. Bernanke is speaking at the annual Fed Conference at Jackson Hole where last year he hinted at QE2. The world will wait for his message on Aug. 26. Calculated Risk has a post on what he expects from this years Jackson Hole speech. There is a building awareness that the Fed is wrecking the currency. On top of the loss in confidence for the US government, the reaction to a new plan of quantitative easing does not guarantee support for financial markets. Doug Noland writes "The American people no longer buy the notion that piling on more debt and “money printing” offers a reasonable solution. They are appreciating that it’s instead the problem, and there will be less tolerance for this “experiment” going forward."
Currency Observations:
Here are recent currency trends for some of the developed economies. These prices are in terms of the foreign currency to the US dollar. Daily, abnormal volatility is observed in the recent months. A power struggle?


Economic Observations:
The US (global) financial system is technically collapsing from the weight of a structural debt problem. There must be signs of a storm on the horizon. The bond market is a good barometer of financial conditions and a gauge for interest rate inflation in particular. Consider the spread between the five year US Treasury Note and the five year Inflation Protected Note. This yield spread is a way to spot bond market concern. If bond investors like the inflation protected feature more, we should see the spread widen, since the five year note is generally less popular than the 10 Yr Bond and requires a lower price, higher yield. The yield is also saying there is not very much concern about the dividend paying capacity (credit worthiness/rising rates) of the issuer, the US Treasury. The current five year note is yielding 0.90% and the inflation protected note is yielding -0.88%. The spread is currently 1.78%, signalling decreasing concern of price inflation. A typical five year spread has been 2.20%. Yields are low and have recently been dropping to new lows.
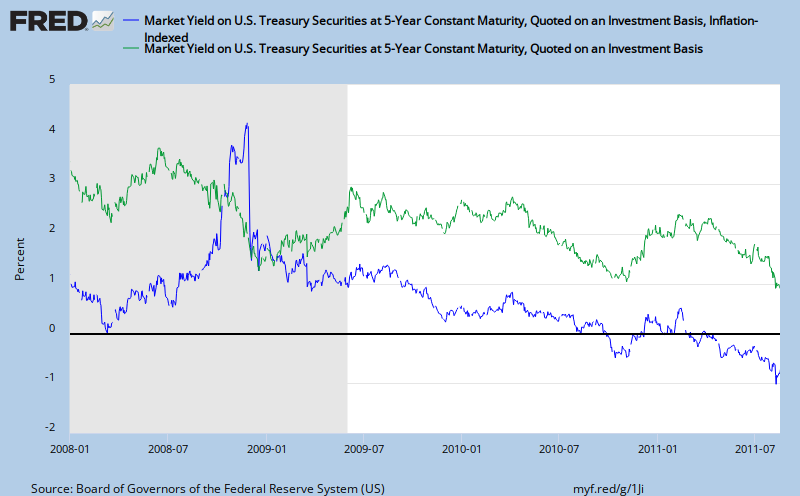
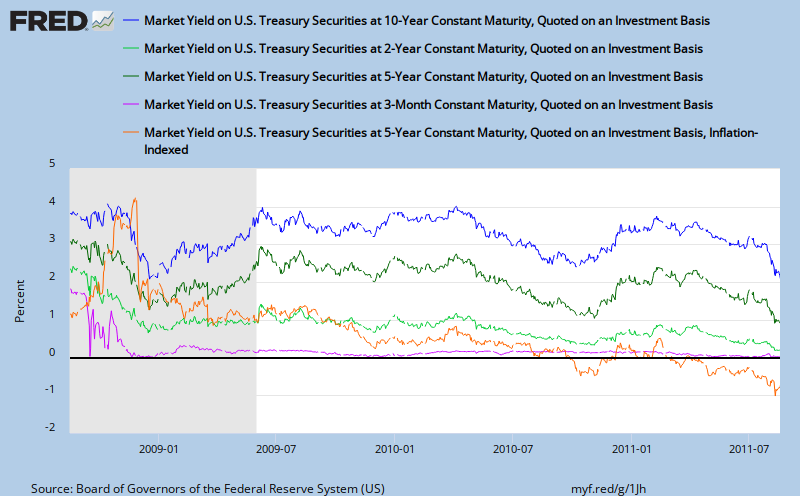
Below is a chart of the interest rate trend of various Treasury debt issues. The recent sharp fall in the interest rate is a reflection of a flight to quality (despite the recent downgrade to AA+ from Standard & Poor's), or pricing for a recession.
Net seasonally adjusted money supply is increasing. This is usually good for equity markets indicating a pool of cash that could be used for investment. Currently, it might not be so supportive of equities if it is more of an indication of consumer savings increasing. I'll look at that further on. The graph below is the ten year chart for M2, updated to 8/8/2011. M2 includes M1, plus time deposits, savings accounts and non-institutional money market deposits. Money supply is cash both for business and consumers to use, as well as money for banks to lend. If business and consumers prefer to borrow, like in the past twenty years, money supply (M2) growth would probably tend to be slow so that disposable income can support growth of debt service requirements. The current trend illustrates cash accumulation.

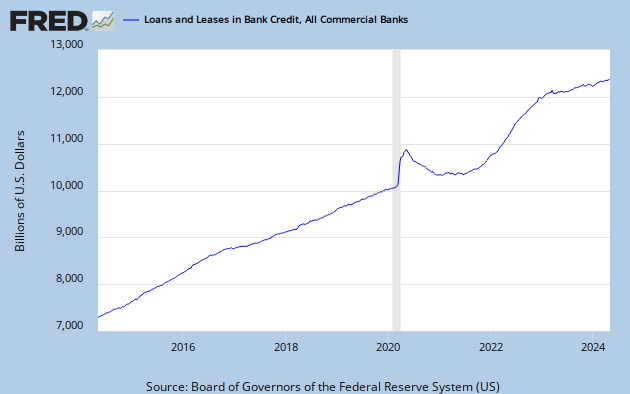
The total of outstanding credit is contracting, as indicated on the following graph. Whether or not you agree that the creating of credit is a fundamental bank service, it is shrinking.
The total of outstanding consumer credit is bottoming, as indicated on the following graph. Will the US consumer return to their pre-crisis spending ways?

The following graph is showing total non-performing loans as a percentage of total loans. Because problem loans are at high levels, banks must create capital to set aside for future losses and that won't help lending grow. This is an alarming trend for lenders. They would be much more comfortable with the level remaining below 2.0%, which still is historically elevated. Instead we see the 'declared' problem exceeds 5% of all loans! What's happening almost weekly since 2008 is that the FDIC was closing banks with high problem loan ratio's and it is assuming the problem loans. More recently, FDIC action has been to put operating restrictions on problem banks forcing their cash flow to problem area resolution. That will keep the percentage from growing more on the graph below updated to 5/27/2011.

Next, here is the current level of the federal budget deficit, a reflection of all of the financial commitments we have made. This is a concern because it impacts the value of the dollar, interest rates and, of course, public policy. The chart is updated to 9/30/2010.

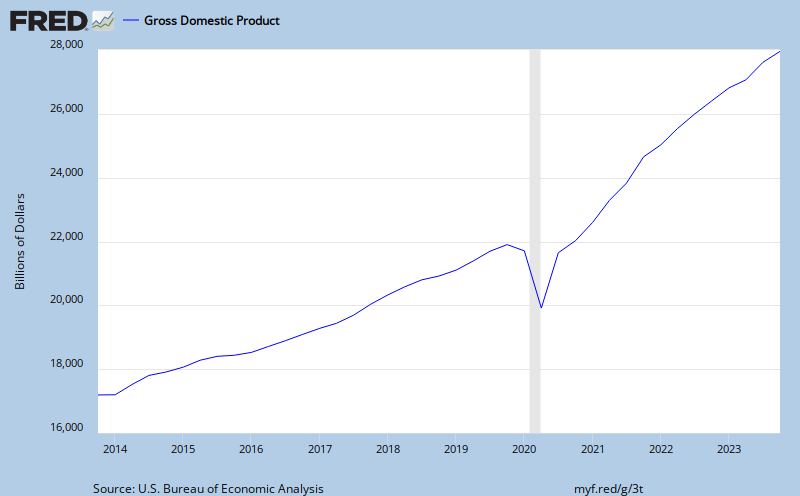
At almost $1.4 trillion dollars, compare the budget deficit to the total annual measured output of our economy, GDP. GDP is the monetary value of all the finished goods and services produced in the U.S.. In other words, how much revenue to cover the the financial commitments we have made.It appears the growth of revenue is returning to trend, at least to 4/1/2011.
Oil is an embedded cost in GDP influencing the cost of goods and transportation of nearly everything (not internet commerce). Not quite as obvious, as the price of oil changes so does the GDP contribution to reducing the federal deficit. The 8/19/2011 price for West Texas Intermediate (WTI) crude oil on the spot market was $80.26.

The yield spread between junk bonds and 10-year Treasuries is also a leading indicator. Widening spreads signal increasing concern over debt issuers, relating now to headlines of economic slowing.

The Worry Indexes identify both concerns relative to debt, the Credit Default Swap (CDS) indexes, and the VIX index, a barometer of stock market risk psychology over the next 30 days.

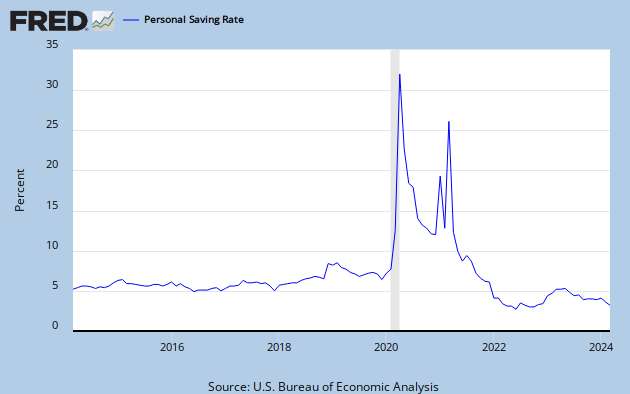
Next, with yields still low, are US savers saving? If yes, it could indicate less disposable income available for personal consumption expenditures. That matters because consumer consumption is the machine that runs nearly 70% of US GDP. The ten year chart below indicates that personal savings is rebounding to 5.4% as of June 1, 2011. This rate is good for the long-term economic health of the economy, but not good for the stock market and businesses relying on personal consumption expenditures. An increasing savings rate is a signal of an economic growth "slowdown".
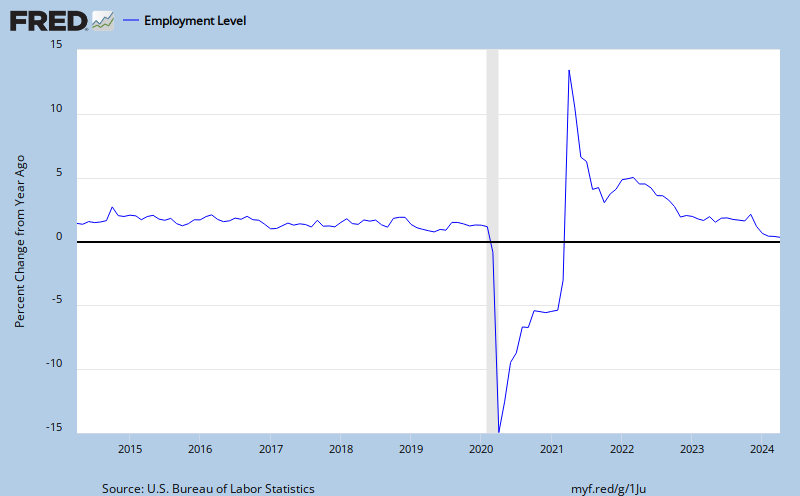
Finally, look at the slowest indicator of economic change, unemployment. Calculated Risk does a thorough job of covering the relationship between the level of unemployment and when we'll enjoy a sustainable recovery in the housing market. It is his premise that "real house prices decline until the unemployment rate peaks - and maybe even decline for a few more years". The following chart illustrates the year over year percent growth in civilian employment up to July 1, 2011.
Obviously, the above measures illustrate a still weak and vulnerable economy, not a strong, growing one. Despite the data, the greatest risk according to mainstream media is that of impending deflation/recession. And the big question in the room now is, will the Fed fulfill the expectation of QE extensions. Chris Puplava has taken on this topic in a post recently. His review includes leading economic indicators and fundamental observations. He titled it Bernanke's Worst Nightmare, Pushing on a String. The Fed's zero interest rate policy is officially here until mid 2013, as of the FOMC Aug 9 meeting. Is quantitative easing going to become officially extended too and what will QE3 look like? My belief has long been that QE is here to stay in some form as a result of the single minded Fed objective of doing anything to prevent deflation from becoming established. Now, all they need is for political winds to shift in their favor. Before that can happen, fear has to sink more deeply into the psychology of global markets. It might get a little frightening first, unless the political foes are weaker than their talk or have been talked on board. And that is very likely. Vice President Biden has spent the past week in China, presumably discussing the Fed plan with leaders there. A stop in Japan on the return trip and the big T-Bond owners are on board with the plan.
Bernanke will speak at the annual Jackson Hole conference this week and my belief is that he will not give a clear public signal about more quantitative easing. He will be more focused on signalling continuation of the Fed's balance sheet at current levels and how it will be managed to maintain financial market support. Behind the public message there is a different message we can speculate over. I think there is an opportunity in managing cash flow from maturities on bonds already held, using that cash to buy a replacement bond of longer maturity to reduce their long-term interest expense because rates are near 50 yr lows. No balance sheet expansion, no new monetary base expansion. How will the markets react? The speech is on Aug 26.