The probability of Greece's default is high as reflected in the yields for their debt. Greek 2 year bonds yield 65.24% and their 10 year debt costs them 22.67% as of 9/29/2011. For reference, 10 year bond yields in other EMU countries are Germany at 2.01%, Italy at 5.58% and Portugal at 11.16%. The US Treasury 10 year is at 2.00%. The problem is how to contain the eventual wreck.
I believe there will be a work through of this crisis in Europe. European countries have dealt with problems of this scale in their past. There has been war, plague, famine and other disasters prior to the EMU forming and have the countries regrouped, rebuilt and recovered as individual countries. Now the question is can they pull off a miracle as a political and monetary union. I'm hoping for their success.
The US Federal Reserve (Fed) has resisted announcement of more quantitative easing (QE). At the September 20-21 meeting of the Fed Open Market Committee (FOMC) monetary policy was adjusted and is still accommodating. We learned from the statement formed at the meeting that there will be restructured refinancing of Treasury debt so that maturing short-term debt will finance new longer term debt, referred to as Operation Twist. There will be continued use of mortgage prepayments for paying down low quality mortgages held at Fannie and Freddie. These steps are accommodative, supporting the stagnant growth status quo.
Kansas City Fed President James Bullard is quoted in a Bloomberg article.
"Bullard told reporters after the speech that he supports
Operation Twist, though he believes it won’t do much to aid the
economy. He doesn’t hold a vote on the Federal Open Market
Committee this year.“I would have supported that,” he said. “I thought the
impact of the program would be marginal, but there was some
analysis presented that suggested there might be an impact from
the program.”
The St. Louis Fed leader said the odds of another recession
have “moved up, but they are not especially high.” He wants to
give the Fed’s measures during the past two months time to work
before considering a new program of asset purchases, he said.
“We have just made two moves” to support growth, he said.
“We need to gauge the impact of those moves before we embark on
a further program.”To be more aggressive, the Fed will need to implement more QE. I believe they want to and are looking for, or they are creating, the economic conditions (fear created by falling markets) to create the political support for ambition in the near future.
Housing is covered thoroughly at Calculated Risk. Here are some links to recent posts there. First on the topic of inventory, improvement: Existing Home Inventory continues to decline
This one covers the latest market environment for sales and refi's, little to no improvement: MBA: Mortgage Purchase Application Index increases. And on the topic of house prices, where homeowners get the feeling of wealth security, still weakening to flat: Real House Prices and House Price-to-Rent.
And from Shadow Government Statistics this graph illustrates new housing starts, seasonally adjusted:

ShadowStats also does the best job of following employment data. They illustrate how government supplied data from the Bureau of Labor Statistics varies from the formula that was used until 1994. By modifying the formula, employment rates look different than if they maintained the formula, enabling comparison of apples to apples. The U-3 unemployment rate is the monthly headline (official) number. The U-6 unemployment rate is the Bureau of Labor Statistics’ (BLS) broadest unemployment measure, including short-term discouraged and other marginally-attached workers as well as those forced to work part-time because they cannot find full-time employment.

Economic Observations:
Here are recent currency trends for some of the developed economies. These prices are in terms of the foreign currency to the US dollar.


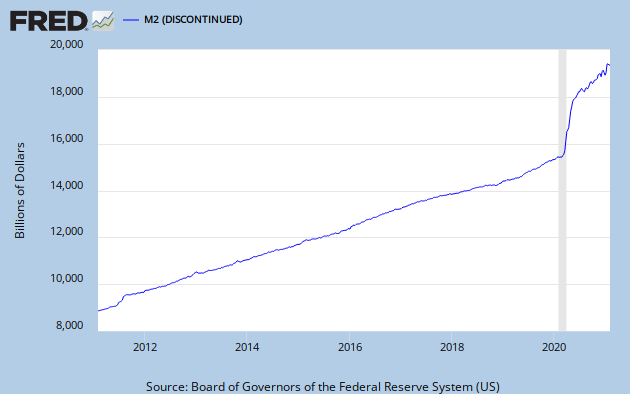
Net seasonally adjusted money supply is increasing. This is usually good for equity markets indicating a pool of cash that could be used for investment. Currently, it might not be so supportive of equities because it might be more of an indication of consumer savings increasing due to concerns about the economic condition in the US. I'll look at that further on. Another reported source of new M2 cash is US Money Market Funds withdrawing liquidity from European banks over concern about the health of several large European banks. The graph below is the current ten year chart for M2. M2 includes M1, plus time deposits, savings accounts and non-institutional money market deposits. Money supply is cash both for business and consumers to use, as well as money for banks to lend. If business and consumers prefer to borrow, like in the past twenty years, money supply (M2) growth would probably tend to be slow so that disposable income can support growth of debt service requirements.
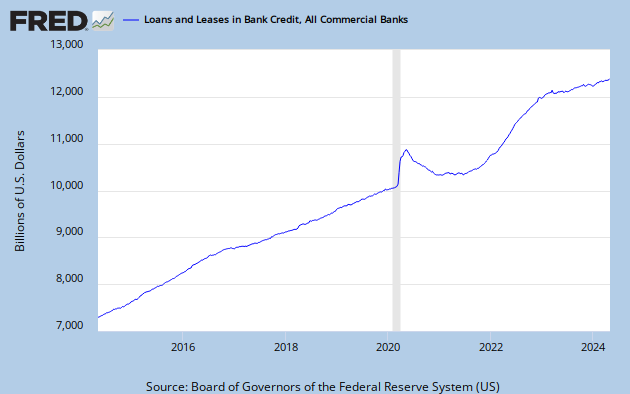
The total of outstanding credit is no longer expanding.
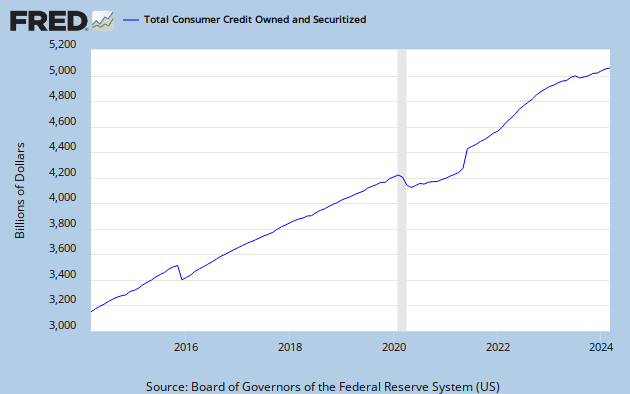
The total of outstanding consumer credit is bottoming, as indicated on the following graph. The US consumer may return to their pre-crisis spending ways, but not likely before there is a restoration of confidence, in their wealth as measured by the value of their home and security in their income.
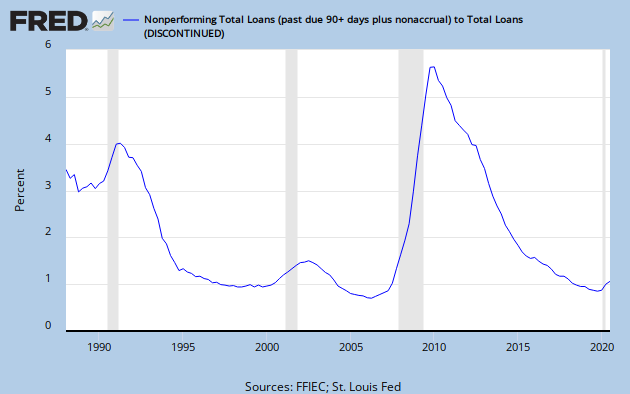
The following graph is showing total non-performing loans as a percentage of total loans. Because problem loans are at high levels, banks must create capital to set aside for future losses and that won't help lending grow. This is an alarming trend for lenders. They would be much more comfortable with the level remaining below 2.0%, which still is historically elevated. Instead we see the 'declared' problem exceeds 4% of all loans! Since 2008 the FDIC is closing banks with high problem loan ratio's and it is assuming the problem loans. More recently, FDIC action has been to put operating restrictions on problem banks forcing their cash flow to problem area resolution. That will keep the percentage from growing more on the graph below.
Next, here is the current level of the federal budget deficit, a reflection of all of the financial commitments we have made. This is a concern because it impacts the value of the dollar, interest rates and, of course, public policy. The chart has not been updated since 9/30/2010!
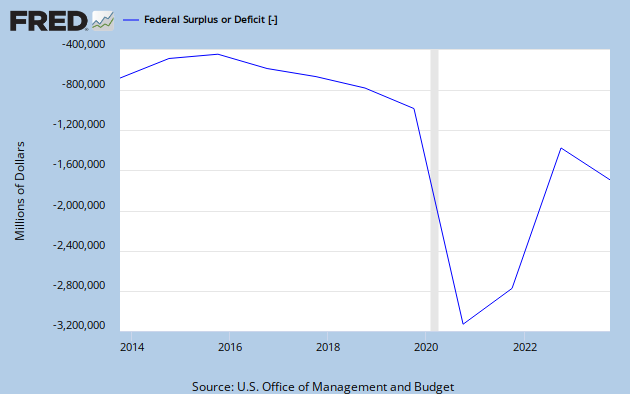
At about $1.3 trillion dollars, compare the budget deficit to the total annual measured output of our economy, GDP, We know that GDP is the monetary value of all the finished goods and services produced in the U.S. In other words, it is the engine we tax to generate revenue used to cover the financial expenditures we have made, not including future commitments made today and not paid for. It appears the growth of revenue is returning to trend but an annual deficit of 10% is obviously not sustainable.
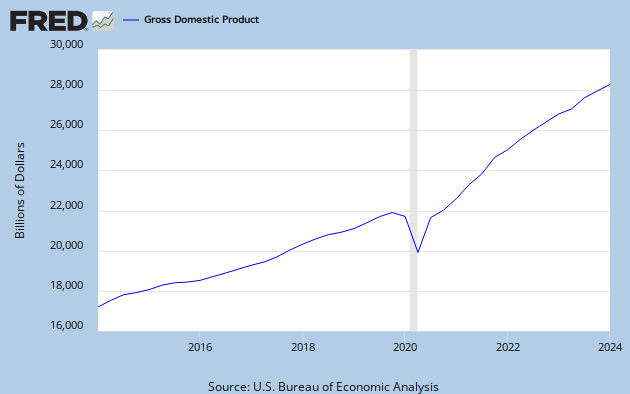
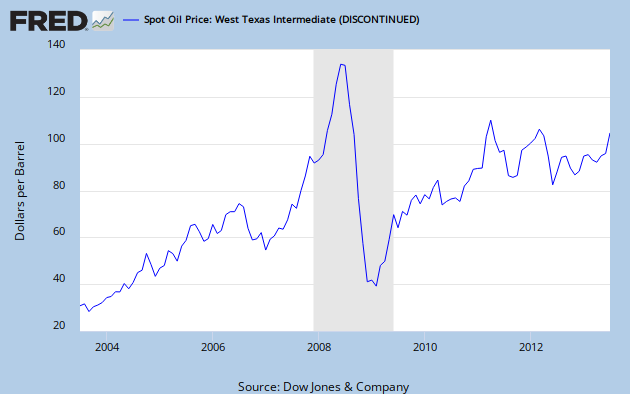
Oil is an embedded cost in GDP influencing the cost of goods and transportation of nearly everything (not internet commerce). Not quite as obvious, as the price of oil changes so does the GDP contribution to reducing the federal deficit. Higher oil, slower economic expansion / lower oil, economic expansion is less costly. The 9/30/2011 price for West Texas Intermediate (WTI) crude oil on the spot market was $78.70.
Is the 10Yr T-Note a leading indicator for the direction of the S&P500? It does looks like one.

Is the US Dollar destined to breach 81 in this cycle? That would not be supportive of the S&P advancing, or would it. Consider the period from Dec 2009 to April 2010.

In conclusion, there is evidence of some improving trends but little to support economic expansion. Stagnation is more evident. I don't consider corporate financial conditions because corporation,s and consumers, are at the mercy of their currency. By monitoring currencies, I have a better than average eye on the political winds and the general direction of financial market trends. Two wild cards for the western economy's are first, what the finance ministers within the eurozone do to tackle their crisis and later, in November, what info the US Congress super-committee on public debt will say/leak about the direction they are heading, creating uncertainty at least temporarily. Doug Noland summed it up differently in his blog last week. Doug said "For now, my analytical framework has me confidently fearing that the deleterious consequences from this cycle’s reflationary excesses will prove especially formidable – and increasingly immune to policy prescriptions. This is what global equity (and CDS and risk asset) prices are shouting rather loudly and clearly, although our market continues listening for that little repetitive whispering voice: “next year is an election year and there’s way too much at stake for Washington to allow a debacle.”". Don't underestimate the importance of the US elections to financial world order.
I read a commentary at Bill Cara Community, by Geoff Goetz, that describes my outlook and he does it better than I would. So I'll give Geoff the credit. Here are his words... "This weekend, I heard and read a lot of recession talk, particularly from those stating that the Economic Cycle Research Institute is forecasting a recession and how they have never been wrong, or something along those lines. From my perch, I'm not sure what the big deal is. First, if you look at work by other economists you will find a "slow growth" scenario, not booming economy, but not recession. Second, watching the treasury bond rally for the last 6-8 months is all you needed to know (bonds rally while yields fall, reflecting a slowing economy). Once again, I will note that months ago, the booming cry heard on financial TV was that the Chinese were going to sell all of their US Treasuries and you better not own any...then the bond market rallied over 20% at the long end. The games stay the same.
Bill mentioned in the Week In Review that; "If the NASDAQ does not break
down, but instead leads S&P 500 to the upside in the next few days,
I think the broad market is likely to lift, and Tech/Semiconductors
will be a leader". He also stated; "If $VIX continues lifting, the
S&P 500 will crash. For that to happen would take a Lehman-type
collapse. Could that happen? Absolutely. The Greece treasury cannot
continue to pay 20-25% on 10-year debt. If the market continues to push
for it, Greece will go bankrupt, and along with it a serious bank
failures. Do I think Greece will be saved? Yes; this is a financial
problem more than an economic problem. In fact, if the Greek economy
gets worse, there will be much bigger unrest there plus some all-out
riots, and that will scare the other nations in Europe plus the UK, the
US and even China to step up with a bail-out package".
So; which is it, a rally or a crash? At this point, we don't know
because the stock market has been trading in a range for 2 months.
However, a likely scenario for the week is a lot of negative news on
social unrest, the economy leading to a selling of stocks going into the
employment number on Friday. If we have a decent sell-off this week,
we could get a nice rally off of the employment "news", just when many
have thrown in the towel.
I remain cautious, but agree with Bill that traders need to be looking
for value in both the broad equity market and especially the gold/silver
miners where fortunes will be made in the future. I will be taking
more bonds off the books and looking to place that capital into equities
at value prices. Remember, with pain comes opportunity."