| Market Index/Data | 12/30/2022 | 2/28/2023 | Week TD Change | Simple YTD |
| Dow Industrials Avg | 33,147.25 | 32,656.70 | -160.22 | -1.48% |
| S&P 500 Index | 3,839.50 | 3,970.15 | 0.11 | 3.40% |
| Fed Funds Rate | 4.33% | 4.57% | -0.01% | 5.54% |
| 10 yr T-note Yld | 3.88% | 3.92% | -0.03% | 1.03% |
| 5 yr T-note Yld | 3.99% | 4.18% | -0.01% | 4.76% |
| 5 yr TIPS - 'Real' Yld | 1.66% | 1.60% | -0.12% | -3.61% |
| Implied 5 yr Inflation % | 2.33% | 2.58% | 0.11% | 10.73% |
| 2 yr T-note Yld | 4.41% | 4.81% | 0.03% | 9.07% |
| 2-10 Yr Slope | -0.53% | -0.89% | -0.06% | 67.92% |
| 90 day T-bill Yld | 4.42% | 4.88% | 0.02% | 10.41% |
| Gold ($/oz) | $1,826.20 | $1,836.70 | $19.60 | 0.57% |
| WTI Oil ($/brl) | $80.26 | $77.05 | $0.73 | -4.00% |
| VIX "Worry Index" | 21.67 | 20.70 | -0.97 | -4.48% |
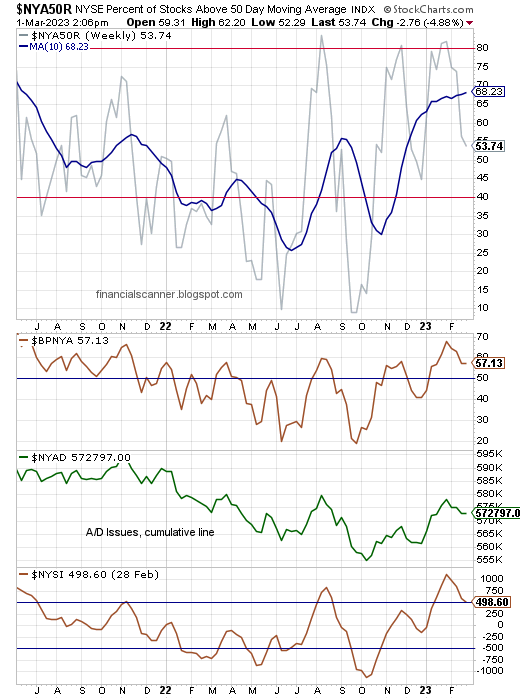
| NYSE Bullish % Index | 40.87% | 57.61% | 0.16% | 40.96% |
|
|
|
|
|
| Credit Data | 12/30/2022 | 2/28/2023 | Week TD Change | Simple YTD |
| iShares Agg. Bond ETF Yield (AGG) | 2.51% | 2.49% | 0.02% | -0.80% |
| SPDR High Yld Credit ETF Yield (JNK) | 6.49% | 6.12% | 0.03% | -5.70% |
| Invest. Gr. to 10 yr T-Note Spread (x 10) | -1370 | -1430 | 50 | -60 |
US Treasury Yields, 90 day, 2, 5, 10 & 30 Yr, Weekly

Investment Grade Credit & Junk Grade Credit, Weekly Price

Inflation Expectations, Weekly

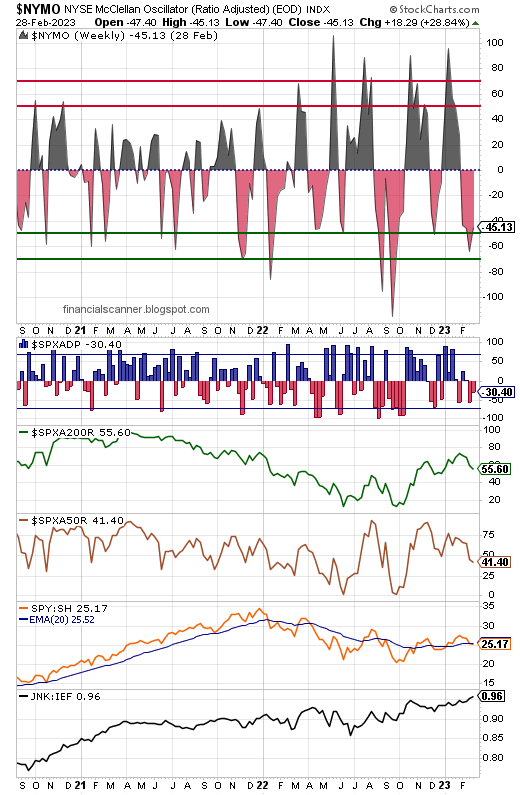
NYSE Internal Sentiment, Weekly
Weekly Worry Indexes
US Dollar Index, Weekly

Gold Spot Price, Weekly (not bullion or coins)
