| Market Index | 12/31 Close | 1/07 Close | Week Change | Simple YTD % |
| Dow Industrials Avg | 11,577.50 | 11,674.80 | 0.84% | 0.84% |
| S&P 500 | 1,257.64 | 1,271.50 | 1.10% | 1.09% |
| Fed Funds Rate | 0.10% | 0.19% | 0.09% | 47.37% |
| 10 yr T-note Yld | 3.29% | 3.36% | 0.07% | 2.08% |
| 5 yr T-note Yld | 2.01% | 1.96% | -0.05% | -2.55% |
| 5 yr TIPS - 'Real' Yld | -0.06% | -0.23% | -0.17% | 73.91% |
| Implied 5 yr Inflation % | 2.07% | 2.19% | 0.12% | 5.48% |
| 2 yr T-note Yld | 0.59% | 0.60% | 0.01% | 1.67% |
| 2-10 Yr Slope | 2.70% | 2.76% | 0.06% | 2.17% |
| 90 day T-bill Yld | 0.12% | 0.13% | 0.01% | 7.69% |
| Gold ($/oz) | $1,421.40 | $1,374.20 | -$47.20 | -3.43% |
| WTI Oil ($/brl) | $91.38 | $89.55 | -$1.83 | -2.04% |
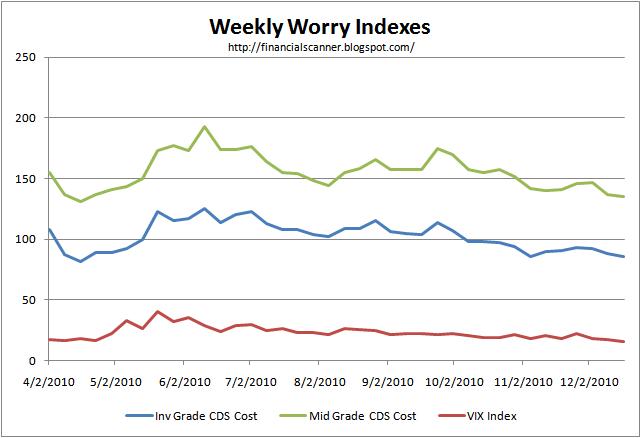
| VIX "Worry Index" | 17.75 | 17.14 | -0.61 | -3.56% |
| Credit Spreads | 12/31 Close | 1/07 Close | Week Change | Simple YTD % |
| Inv Grade Credit Idx | 4.78% | 4.70% | -0.08% | -1.70% |
| Low Grade Credit Idx | 8.32% | 8.00% | -0.32% | -4.00% |
| Markit CDX Inv Grd Idx | 85 | 87 | 2.35% | 2.30% |
| Markit CDX Mid Grd Idx | 131 | 127 | -3.05% | -3.15% |
Monday, January 10, 2011
Market Data: Week Ending January 7, 2011
Friday, January 7, 2011
Watching DXY Correlation
It's a New Year and looking backwards can be interesting. We saw currency markets turning exceptionally volatile and solid results continuing in both bond and stock markets. Precious metals and commodities provided outperformance in 2010.
Today, it's time to look at now and into the future. It looks to me like the time to reduce equity market risk for conservative portfolio's and to look for an attractive entry point for the new positions. More aggressive portfolio's can tolerate the equity markets better. IMHO, it may be that the equity indexes have more upward resistance from the US$ index which has been busting higher, currently through 81. This can be illustrated with the price correlation between the two prices, which as seen next, no longer seems intact, at least for the recent past.
Today, it's time to look at now and into the future. It looks to me like the time to reduce equity market risk for conservative portfolio's and to look for an attractive entry point for the new positions. More aggressive portfolio's can tolerate the equity markets better. IMHO, it may be that the equity indexes have more upward resistance from the US$ index which has been busting higher, currently through 81. This can be illustrated with the price correlation between the two prices, which as seen next, no longer seems intact, at least for the recent past.
The
graph below shows the scenario as of last night, illustrating the US$ index in
candlesticks and the S&P 500 in the black line.

Next is a look at the US$ index with the DBP (precious metals) ETF as a metals proxy. Price weakness is already seen in the metals. The price correlation between these two prices still seems intact.
Monday, January 3, 2011
Market Data & Graphs: Week Ending December 31, 2010
| Market Index | 2009 Close | 12/31 Close | Week Change | Simple YTD % |
| Dow Industrials Avg | 10428.05 | 11,577.50 | 0.03% | 11.02% |
| S&P 500 | 1115.1 | 1,257.64 | 0.07% | 11.33% |
| Fed Funds Rate | 0.25% | 0.10% | -0.11% | -150.00% |
| 10 yr T-note Yld | 3.85% | 3.29% | -0.10% | -17.02% |
| 5 yr T-note Yld | 2.01% | -0.05% | ||
| 5 yr TIPS - 'Real' Yld | -0.06% | -0.05% | ||
| Implied 5 yr Inflation % | 2.07% | 0.00% | ||
| 2 yr T-note Yld | 1.14% | 0.59% | -0.06% | -0.55% |
| 2-10 Yr Slope | 2.70% | 2.70% | -0.04% | 0.00% |
| 90 day T-bill Yld | 0.12% | -0.01% | ||
| Gold ($/oz) | $1,096.95 | $1,421.40 | 2.88% | 29.58% |
| WTI Oil ($/brl) | $79.36 | $91.38 | -0.14% | 15.15% |
| VIX "Worry Index" | 21.68 | 17.75 | 7.77% | -18.13% |
| Credit Spreads | 12/31 Close | Week Change | ||
| Inv Grade Credit Idx | 4.78% | -0.05% | ||
| Low Grade Credit Idx | 8.32% | -0.04% | ||
| Markit CDX Inv Grd Idx | 85 | -1.16% | ||
| Markit CDX Mid Grd Idx | 131 | -0.76% |


Monday, December 27, 2010
Market Data: Week Ending December 24, 2010
| Market Index | 2009 Close | 12/24 Close | Week Change | Simple YTD % |
| Dow Industrials Avg | 10428.05 | 11,573.50 | 0.71% | 10.98% |
| S&P 500 | 1115.1 | 1,256.77 | 1.03% | 11.27% |
| Fed Funds Rate | 0.25% | 0.21% | -0.01% | -19.05% |
| 10 yr T-note Yld | 3.85% | 3.39% | 0.06% | -13.57% |
| 5 yr T-note Yld | 2.06% | 0.11% | ||
| 5 yr TIPS - 'Real' Yld | -0.01% | -0.02% | ||
| Implied 5 yr Inflation % | 2.07% | 0.13% | ||
| 2 yr T-note Yld | 1.14% | 0.65% | 0.04% | -0.49% |
| 2-10 Yr Slope | 2.70% | 2.74% | 0.02% | 0.04% |
| 90 day T-bill Yld | 0.13% | 0.03% | ||
| Gold ($/oz) | $1,096.95 | $1,380.50 | 0.09% | 25.85% |
| WTI Oil ($/brl) | $79.36 | $91.51 | 3.97% | 15.31% |
| VIX "Worry Index" | 21.68 | 16.47 | 2.23% | -24.03% |
| Credit Spreads | 12/24 Close | Week Change | ||
| Inv Grade Credit Idx | 4.83% | -0.03% | ||
| Low Grade Credit Idx | 8.36% | -0.03% | ||
| Markit CDX Inv Grd Idx | 86 | 0.00% | ||
| Markit CDX Mid Grd Idx | 132 | -2.22% |
Wednesday, December 22, 2010
Inflation Forecasting
Two economic analysts at the Cleveland Fed published their article earlier this month on the Banks web site. Brent H. Meyer and Mehmet Pasaogullari wrote Simple Ways to Forecast Inflation: What Works Best?. For this article, they investigate a few simple statistical models to forecast Consumer Price
Index (CPI) inflation, along with some even-simpler rules of thumb. They investigate two readily available survey measures of
one-year-ahead inflation expectations, the median expectation from the
University of Michigan’s Survey of Consumers (UM) and the
median expectation for CPI inflation from the Federal Reserve Bank of
Philadelphia’s Survey of Professional Forecasters (SPF).
They conclude that there is no standout method. They were impressed with the ability of 'inflation expectations' to accurately anticipate the correct level of inflation. Specifically, they noticed that measurements of inflation expectation such as the UM survey and the Philly Fed's SPF, mentioned earlier, produced forecasts that were more accurate than most of the statistically based models they investigated.
These measures are intriguing as forecasting tools, as it is highly
plausible that, given wage and price stickiness, individuals embed
expectations of future inflation into their price-setting and
decision-making behavior today. In fact, if you’ve read or listened to a
Federal Reserve official lately, chances are you’ve probably heard
something to the effect of “inflation expectations matter.” Indeed,
central bankers’ sensitivity to inflation expectations seems warranted,
as it is theoretically possible that expectations can be self-fulfilling
prophecies. However, we are mainly interested in the forecasting
properties of these measures here.
They conclude that there is no standout method. They were impressed with the ability of 'inflation expectations' to accurately anticipate the correct level of inflation. Specifically, they noticed that measurements of inflation expectation such as the UM survey and the Philly Fed's SPF, mentioned earlier, produced forecasts that were more accurate than most of the statistically based models they investigated.
Subscribe to:
Posts (Atom)