| Market Index | 12/31 Close | 10/14 Close | Week Change | Simple YTD % |
| Dow Industrials Avg | 11,577.50 | 11,566.00 | 4.17% | -0.10% |
| S&P 500 | 1,257.64 | 1,219.20 | 5.52% | -3.06% |
| Fed Funds Rate | 0.10% | 0.08% | 0.00% | -20.00% |
| 10 yr T-note Yld | 3.29% | 2.25% | 0.17% | -31.61% |
| 5 yr T-note Yld | 2.01% | 1.11% | 0.03% | -44.78% |
| 5 yr TIPS - 'Real' Yld | -0.06% | -0.61% | 0.05% | -916.67% |
| Implied 5 yr Inflation % | 2.07% | 1.72% | -0.02% | -16.91% |
| 2 yr T-note Yld | 0.59% | 0.27% | -0.02% | -54.24% |
| 2-10 Yr Slope | 2.70% | 1.98% | 0.19% | -26.67% |
| 90 day T-bill Yld | 0.12% | 0.01% | 0.00% | -91.67% |
| Gold ($/oz) | $1,421.40 | $1,683.00 | $47.20 | 18.40% |
| WTI Oil ($/brl) | $91.38 | $86.80 | $3.82 | -5.01% |
| VIX "Worry Index" | 17.75 | 28.24 | -7.96 | 59.10% |
| Credit Spreads | 12/31 Close | 10/14 Close | Week Change | Simple YTD % |
| Inv Grade Credit Idx | 4.78% | 4.82% | -0.08% | 0.84% |
| Low Grade Credit Idx | 8.32% | 8.49% | -0.28% | 2.04% |
| Markit CDX Inv Grd Idx | 85 | 133 | -4.32% | 56.47% |
| Markit CDX Mid Grd Idx | 131 | 233 | -7.91% | 77.86% |
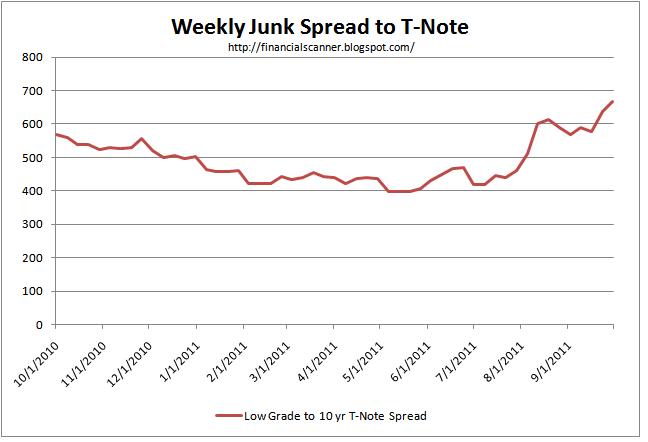
| Low Grade to 10 yr T-Note Spread | 503 | 624 | -45 | 24.06% |
Monday, October 17, 2011
Market Data: Week Ending October 14, 2011
Friday, October 14, 2011
Volatile and Sluggish Growth Will Persist
Calculated Risk has a post today that describes the stock market landscape in the light of relevant facts and filtered emotion. His post is based on an article in the WSJ. Here is a link to the post and the conclusion he writes is what follows.
"Although growth is sluggish - due to the significant slack in the system (excess capacity, lack of demand) and also high levels of household debt, I think the volatility this year can be blamed on a series of events including extreme weather (significant snow storms, flooding, hurricane Irene), the oil price increase related to the "Arab Spring", the tsunami in Japan, and the debt ceiling debate in D.C. during late July and early August.
Also the ongoing European financial crisis keeps flaring up and impacting the U.S. economy.
Yes, the economy is very sluggish - 103,000 jobs was a weak report, just better than low expectations - but I think the economic volatility is related to events and hopefully not some new normal."
"Although growth is sluggish - due to the significant slack in the system (excess capacity, lack of demand) and also high levels of household debt, I think the volatility this year can be blamed on a series of events including extreme weather (significant snow storms, flooding, hurricane Irene), the oil price increase related to the "Arab Spring", the tsunami in Japan, and the debt ceiling debate in D.C. during late July and early August.
Also the ongoing European financial crisis keeps flaring up and impacting the U.S. economy.
Yes, the economy is very sluggish - 103,000 jobs was a weak report, just better than low expectations - but I think the economic volatility is related to events and hopefully not some new normal."
Monday, October 10, 2011
Market Data: Week Ending October 7, 2011
| Market Index | 12/31 Close | 10/07 Close | Week Change | Simple YTD % |
| Dow Industrials Avg | 11,577.50 | 11,103.10 | 1.74% | -4.10% |
| S&P 500 | 1,257.64 | 1,155.46 | 2.12% | -8.12% |
| Fed Funds Rate | 0.10% | 0.08% | 0.00% | -20.00% |
| 10 yr T-note Yld | 3.29% | 2.08% | 0.16% | -36.78% |
| 5 yr T-note Yld | 2.01% | 1.08% | 0.13% | -46.27% |
| 5 yr TIPS - 'Real' Yld | -0.06% | -0.66% | -0.05% | -1000.00% |
| Implied 5 yr Inflation % | 2.07% | 1.74% | 0.18% | -15.94% |
| 2 yr T-note Yld | 0.59% | 0.29% | 0.05% | -50.85% |
| 2-10 Yr Slope | 2.70% | 1.79% | 0.11% | -33.70% |
| 90 day T-bill Yld | 0.12% | 0.01% | -0.01% | -91.67% |
| Gold ($/oz) | $1,421.40 | $1,635.80 | $13.50 | 15.08% |
| WTI Oil ($/brl) | $91.38 | $82.98 | $3.78 | -9.19% |
| VIX "Worry Index" | 17.75 | 36.2 | -6.76 | 103.94% |
| Credit Spreads | 12/31 Close | 10/07 Close | Week Change | Simple YTD % |
| Inv Grade Credit Idx | 4.78% | 4.90% | 0.10% | 2.51% |
| Low Grade Credit Idx | 8.32% | 8.77% | 0.17% | 5.41% |
| Markit CDX Inv Grd Idx | 85 | 139 | -0.71% | 63.53% |
| Markit CDX Mid Grd Idx | 131 | 253 | 1.20% | 93.13% |
| Low Grade to 10 yr T-Note Spread | 503 | 669 | 1 | 33.00% |
Tuesday, October 4, 2011
Economic Condition Review
Here at the end of the 3Q2011 all eyes are focused on the European Union (EU), the European Central Bank (ECB), the International Monetary Fund (IMF), the Federal Reserve Bank (FRB), and now laser like focus on the 17 European Monetary Union (EMU) parliaments who are individually considering their agreement to further assistance for Greece. The process is complicated by the complexity of the euro currency experiment. It is also complicated by the number of politicians in positions of influence. I hope cynicism is reaching high tide. The danger is extreme if there is not a plan developed to corral the ripple effects from what is expected to be substantial losses to major banks who are Greece's sovereign debt owners. One danger is that there is a known lack
of adequate reserve capital at several European banks due to their investment in the
sovereign debt of Greece and other over indebted countries. Compounding the
problem is the lack of detailed information about credit default swaps intended to hedge risk on Greek debt. Lack of information deepens the fear.
The probability of Greece's default is high as reflected in the yields for their debt. Greek 2 year bonds yield 65.24% and their 10 year debt costs them 22.67% as of 9/29/2011. For reference, 10 year bond yields in other EMU countries are Germany at 2.01%, Italy at 5.58% and Portugal at 11.16%. The US Treasury 10 year is at 2.00%. The problem is how to contain the eventual wreck.
The probability of Greece's default is high as reflected in the yields for their debt. Greek 2 year bonds yield 65.24% and their 10 year debt costs them 22.67% as of 9/29/2011. For reference, 10 year bond yields in other EMU countries are Germany at 2.01%, Italy at 5.58% and Portugal at 11.16%. The US Treasury 10 year is at 2.00%. The problem is how to contain the eventual wreck.
Monday, October 3, 2011
Market Data: Week Ending September 30, 2011
| Market Index | 12/31 Close | 9/30 Close | Week Change | Simple YTD % |
| Dow Industrials Avg | 11,577.50 | 10,913.40 | 2.02% | -5.74% |
| S&P 500 | 1,257.64 | 1,131.42 | 0.14% | -10.04% |
| Fed Funds Rate | 0.10% | 0.08% | -0.02% | -20.00% |
| 10 yr T-note Yld | 3.29% | 1.92% | 0.09% | -41.64% |
| 5 yr T-note Yld | 2.01% | 0.95% | 0.08% | -52.74% |
| 5 yr TIPS - 'Real' Yld | -0.06% | -0.61% | 0.02% | -916.67% |
| Implied 5 yr Inflation % | 2.07% | 1.56% | 0.06% | -24.64% |
| 2 yr T-note Yld | 0.59% | 0.24% | 0.02% | -59.32% |
| 2-10 Yr Slope | 2.70% | 1.68% | 0.07% | -37.78% |
| 90 day T-bill Yld | 0.12% | 0.02% | 0.01% | -83.33% |
| Gold ($/oz) | $1,421.40 | $1,622.30 | -$17.50 | 14.13% |
| WTI Oil ($/brl) | $91.38 | $79.20 | -$0.65 | -13.33% |
| VIX "Worry Index" | 17.75 | 42.96 | 1.71 | 142.03% |
| Credit Spreads | 12/31 Close | 9/30 Close | Week Change | Simple YTD % |
| Inv Grade Credit Idx | 4.78% | 4.80% | 0.11% | 0.42% |
| Low Grade Credit Idx | 8.32% | 8.60% | 0.40% | 3.37% |
| Markit CDX Inv Grd Idx | 85 | 140 | -4.11% | 64.71% |
| Markit CDX Mid Grd Idx | 131 | 250 | 11.11% | 90.84% |
| Low Grade to 10 yr T-Note Spread | 503 | 668 | 31 | 32.80% |


Subscribe to:
Posts (Atom)