| Market Index/Data | 12/31/2021 | 3/1/2022 | Week Change | Simple YTD |
| Dow Industrials Avg | 36,338.30 | 33,294.95 | -763.80 | -8.38% |
| S&P 500 Index | 4,766.18 | 4,306.26 | -78.39 | -9.65% |
| Fed Funds Rate | 0.08% | 0.08% | 0.00% | 0.00% |
| 10 yr T-note Yld | 1.50% | 1.72% | -0.25% | 14.67% |
| 5 yr T-note Yld | 1.26% | 1.56% | -0.30% | 23.81% |
| 5 yr TIPS - 'Real' Yld | -1.61% | -1.40% | -0.24% |
|
| Implied 5 yr Inflation % | 2.87% | 2.96% | -0.06% | 3.14% |
| 2 yr T-note Yld | 0.73% | 1.31% | -0.24% | 79.45% |
| 2-10 Yr Slope | 0.77% | 0.41% | -0.01% | -46.75% |
| 90 day T-bill Yld | 0.06% | 0.32% | -0.01% | 433.33% |
| Gold ($/oz) | $1,828.60 | $1,943.80 | $56.20 | 6.30% |
| WTI Oil ($/brl) | $75.21 | $103.41 | $11.82 | 37.50% |
| VIX "Worry Index" | 17.22 | 33.32 | 5.73 | 93.50% |
| NYSE Bullish % Index | 54.76% | 40.51% | 2.36% | -26.02% |
|
|
|
|
|
| Credit Data | 12/31/2021 | 3/1/2022 | Week Change | Simple YTD |
| iShares Agg. Bond ETF Yield (AGG) | 1.83% | 1.80% | -0.02% | -1.64% |
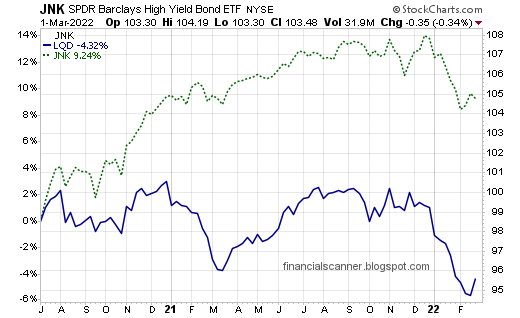
| SPDR High Yld Credit ETF Yield (JNK) | 4.66% | 4.48% | 0.04% | -3.86% |
| Invest. Gr. to 10 yr T-Note Spread (x 10) | 330 | 80 | 230 | -250 |
US Treasury Yields, 90 day, 2, 5, 10 & 30 Yr, Weekly

Investment Grade Credit & Junk Grade Credit, Weekly Price
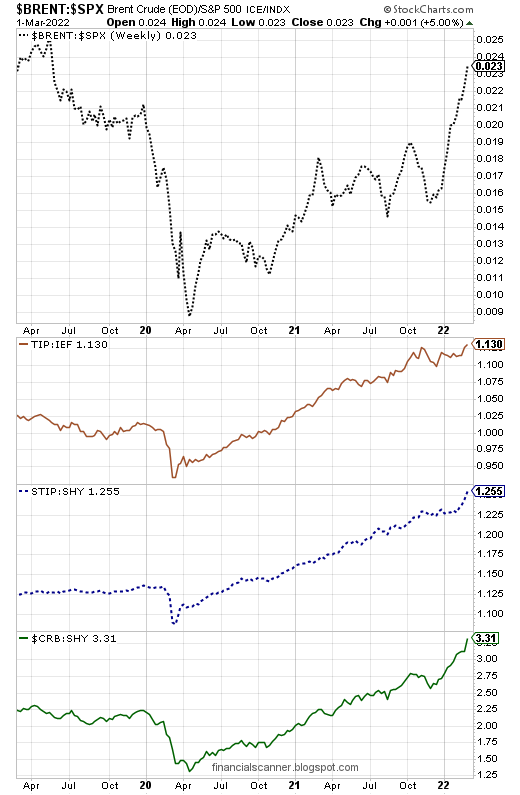
Inflation Expectations, Weekly
NYSE Internal Sentiment, Weekly

Weekly Worry Indexes

US Dollar Index, Weekly (not weighted by trade partners)

Gold Spot Price, Weekly (not bullion or coins)
